 Blog
Blog
How to Get Real-Time Global Network Visibility in an Enterprise VoIP Deployment
Brian Kaufman
June 28, 2016
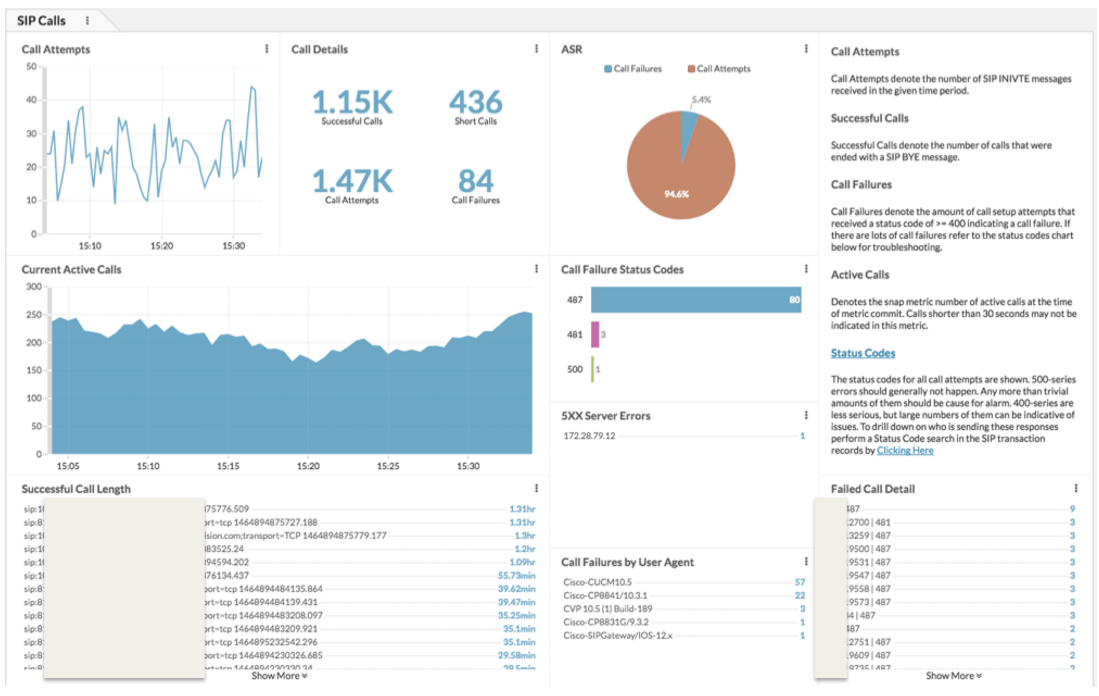
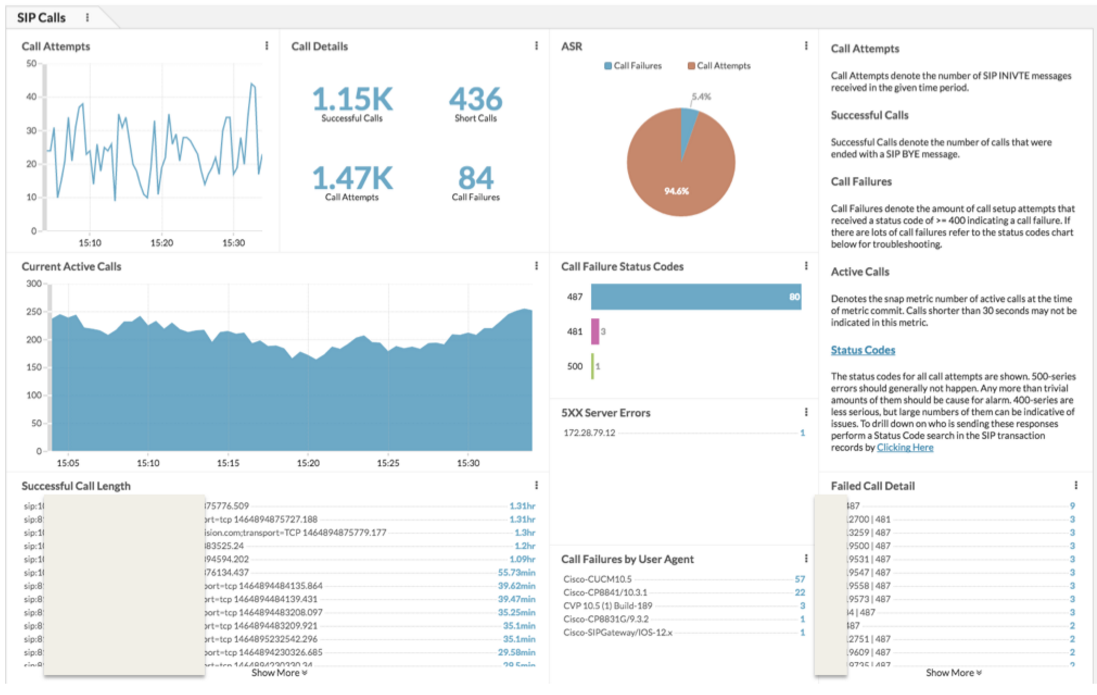
The ExtraHop VoIP-SIP calls dashboard shows a global view of conditions across your whole enterprise VoIP deployment.
Today's VoIP networks often involve multiple disparate systems interworked together with many different protocols, call routing, and load balancing strategies in play. Whether a user is making an internal call from a Skype for Business(Lync) client to an AVAYA hard phone or an outbound call via SIP trunk, gaining global visibility into your VoIP network often requires the use of many vendor specific tools which likely have blind spots when benchmarking or troubleshooting.
Additionally, with the rise of API-based communication products in the enterprise such as Twilio, web services like WebRTC, and CRM integrations, a unified, vendor-agnostic monitoring strategy that spans multiple protocols and provides flexibility to blend into unique networking environments is needed now more than ever.
Events such as SIP registration floods, TCP Zero Windows, and failed load balancing or call-routing strategies can be difficult to track down without getting a Wireshark trace of the traffic at just the right time. As we all know, this is a task much easier said than done. For those that have Skype on-premises deployments, the backend database servers add a new component that needs to be monitored outside traditional VoIP infrastructure. Days if not weeks can be spent collecting and sending traces to vendors with hopes that they can point you in the right direction to track down what may be a service-impacting issue.
Without global visibility, managing a complex VoIP network can be a very stressful occupation to say the least. There is however a common denominator in all this complexity. Each piece of infrastructure, regardless of vendor, will communicate over your network.
Gaining Global Visibility with ExtraHop VoIP Monitoring
Since ExtraHop is able to automatically discover devices and provide complete layer 2-7 visibility it is possible to profile every server in a given network. This means that regardless of the protocols being used or appliance vendor ExtraHop will be able to see and parse the traffic going to or coming from each server in real time as well as provide historical lookback.
This post provides an overview of a new VoIP bundle ExtraHop platform users can download and install to gain global VoIP insight into the following:
- Call/Session Status And Volume
- Load Balancing and Routing
- Call Quality
- Non-VoIP Protocols Supporting VoIP Infrastructure
Call Status And Volume
The 'SIP VoIP Call Dashboard' bundle stitches call signaling and media together to provide call statistics that summarize important VoIP details throughout a network into a single global view. The following metrics are available:
- Active calls
- Call Attempts
- Call Failures
- 5XX error codes by gateway
- Short Calls(Calls <30 seconds)
- Call Length
- Call Failures by User-Agent Header
The above metrics are gathered globally and allow the end user to easily monitor system-wide call processing as well as rapidly trace call failures to a certain gateway or handset.
Load Balancing and Routing
The bundle displays the volumes of each SIP request and response message. From there you can expose all L2-L7 communications from each server whose traffic is detected. The screenshot below shows a server, SIP4.EXHP, that received all the registration messages instead of them being load balanced evenly across the cluster which overloaded the server and caused an avalanche of 503 messages.
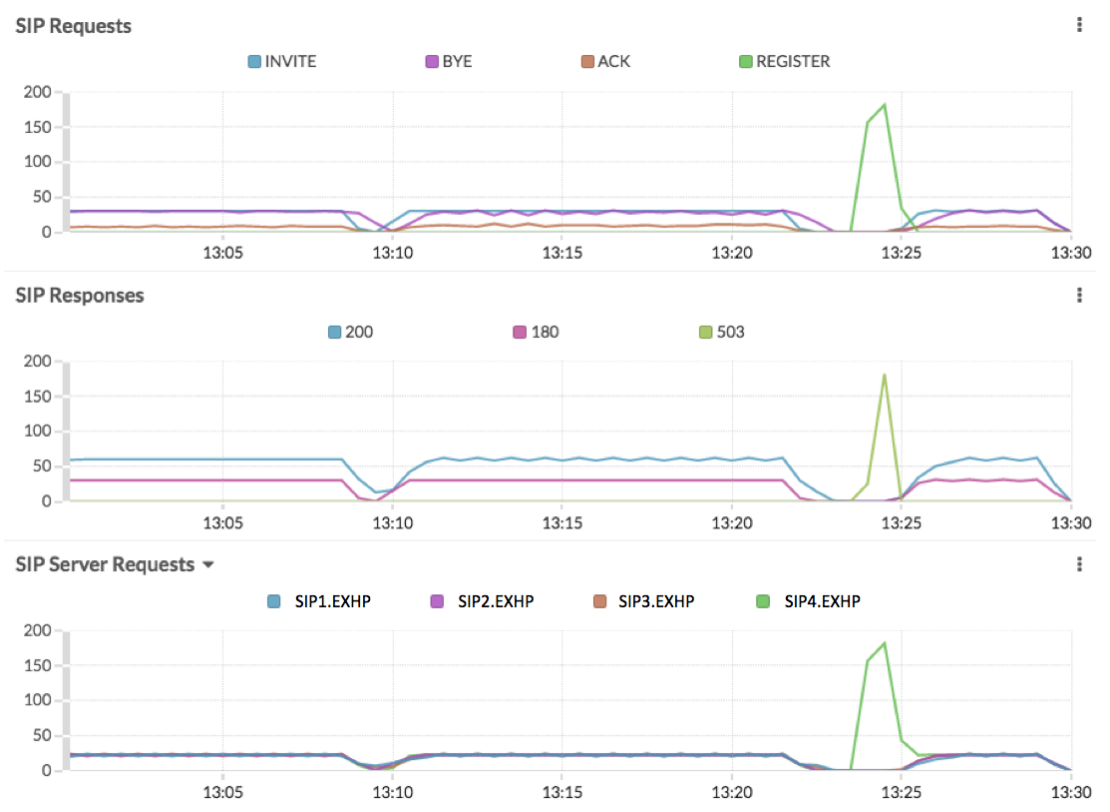
The ExtraHop SIP/VoIP Monitoring dashboard.
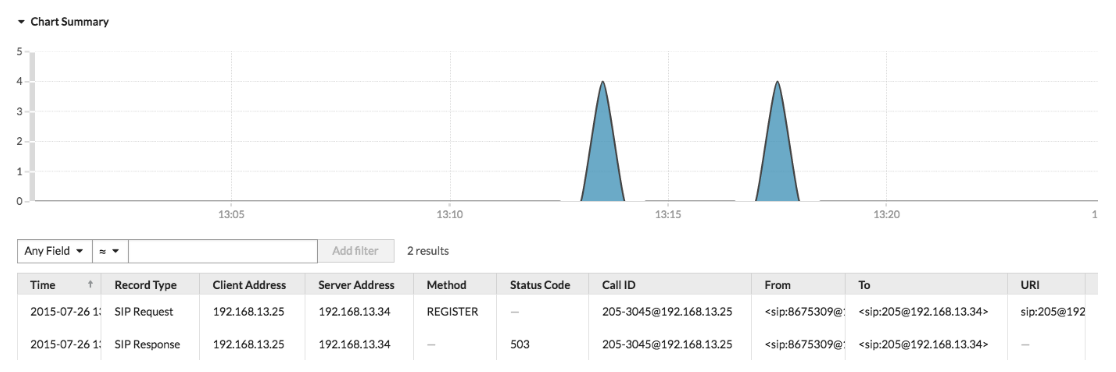
Identifying failed calls is drastically simplified along with the gateway that sent the failed call status code. When combined with the ExtraHop Explorer Appliance further detailed transaction logs are available showing all signaling messages and if present RTP metrics including MOS scores calculated every 30 seconds.
Call Quality
The bundle shows you the worst-performing calls by Mean Opinion Score (MOS) as well as showing valuable MOS averages and codec information. It is possible to deploy the bundle in a way that provides a gateway or branch-office view in addition to the global view. This is invaluable when determining if a call-quality issue is unique to a type of handset, branch location, or gateway.
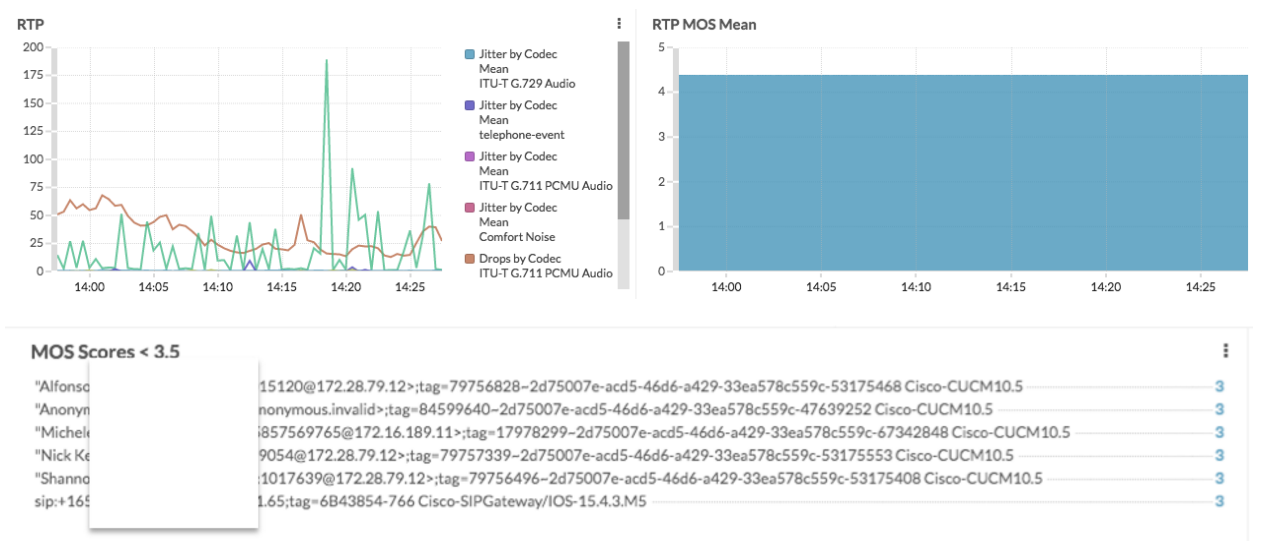
SIP call quality view based on Mean Opinion Scores (MOS).
Non-VoIP Protocols Supporting VoIP Infrastructure
Global visibility means more than just looking at traditional VoIP traffic. With regard to Microsoft Lync deployments it's also necessary to monitor database-processing times on the backend servers to make sure there is no bottleneck which could impact call processing upstream. This is easily done by passively watching the time between the last packet of a request and the first packet of the corresponding response with payload for database transactions across the backend servers. This allows the end user to quickly spot and send alerts based on database latency issues that could have harmful impacts upstream. This database view can be added under the signaling metrics the bundle displays on the 'SIP-Network' dashboard to allow for easy temporal correlation across all tiers of your VoIP infrastructure:
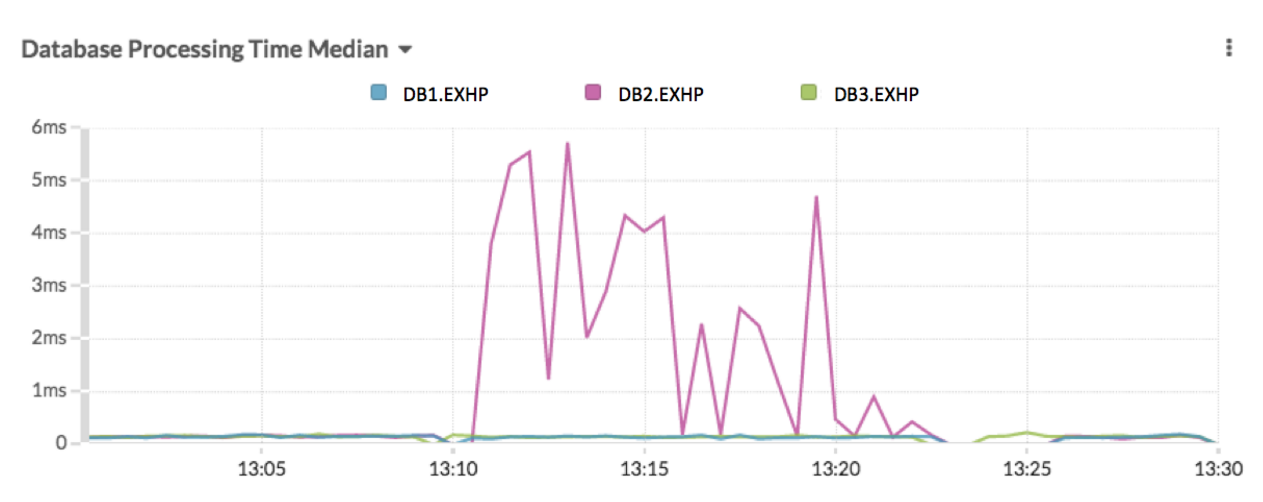
SIP metrics correlated with database processing time.
The value of stream analytics goes far beyond getting visibility into your VoIP deployment. Once you're gathering and analyzing wire data in your environment, you can use it as the foundation of a comprehensive IT Operations Analytics plan. Learn how in our Guide to Designing and Building an Open ITOA Architecture.
Discover more
