Real-User Monitoring's Next Frontier: Context, Context, Context!
Back to top
May 4, 2015
Real-User Monitoring's Next Frontier: Context, Context, Context!
Since the early days of the Internet, site owners and admins have craved deeper, more meaningful insight into user experience. Knowing what happens when someone visits your site is strategically valuable since website and application performance are tightly linked with revenue and growth for many companies.
Early Approaches to RUM
Real-user monitoring (also called end-user experience monitoring by some companies) has focused heavily on a single metric: page-load time. In the early days, page-load time was calculated by passively monitoring HTTP transactions. These requests and responses were put through a byzantine process of HTML parsing, referrer/header parsing, and sessionization to determine which elements were part of the page. Eventually, the system figured out when the last element was sent to the user from the server, and used that information to calculate a theoretical page-load time.
In the late 1990s and early 2000s, several companies emerged to provide real-user monitoring tools in this vein. [Tealeaf](http://www-01.ibm.com/software/info/tealeaf/], BeatBox, and Coradiant were three notable early RUM providers that went through various acquisitions and were eventually rolled into the application monitoring and management offerings of IBM, HP, and BMC, respectively.
The Problem with Early Real-User Monitoring
While the early approach to RUM provided some useful data, it had two serious drawbacks and limitations: 1. The processing required for calculating a theoretical page-load time based on when the last element was served was expensive in terms of computational resources. 2. When asynchronous JavaScript became ubiquitous on the web, knowing when the last element was sent from your server to the user became a much less reliable indicator of how people actually experienced your website or web application.
These factors led to a rapidly diminishing return on the investment in old-school RUM/EUEM tools. However, the need to understand user experience has only intensified since then, as more business-critical operations rely on the web.
Enter the Navigation-Timing API
The death knell for the old-school approach to RUM/EUEM came with the widespread implementation of the Navigation-Timing API in every modern browser. This API provides access to timing data for more than 20 attributes that affect load time and overall experience when someone visits a website or uses a web-based application. Using fairly basic JavaScript, anyone can access this data and process it however they like. This approach made acquiring accurate page load-time metrics much simpler than before, and organizations were quick to capitalize on it.
Hot on the heels of the Navigation-Timing API came a free, Open Source tool called Boomerang, which uses JavaScript to extract relevant page construction and load-time metrics from the web browser and transmit them back to the page owner. There are numerous tools with similar functionality, but Boomerang's Open Source status and flexibility make it a popular option.
What ExtraHop Brings to the RUM Party
The powerful combination of boomerang.js and the Navigation-Timing API heralded a new era for real-user monitoring. But what if you could correlate human experience on the web with the performance of the network, web servers, database, and other components of your application delivery chain? Knowing your user's perceived page-load time is important, but even better is knowing why they had the experience they did and what you can do to improve performance.

ExtraHop's real-user monitoring capabilities use the Boomerang navigation beacon to deliver accurate browser timing metrics, then correlates that info with network and server performance data for an end-to-end view of user experience.
This is where ExtraHop's new RUM bundle provides unique value for site owners as well as for the web operations teams that are ultimately responsible for tuning and troubleshooting web performance. ExtraHop's RUM bundle combines data provided by boomerang.js with all of the metrics provided by our platform natively to show an end-to-end view of the client, the networks, and the servers involved in a web application. ExtraHop's platform allows you to graph a user's perceived page-load time against 3,000+ back-end performance metrics such as server processing time and TCP retransmissions to generate a truly complete picture of the user's experience and the infrastructure that delivers it.
Marketing and Business Insights
The ExtraHop approach to RUM merges insights from wire data and machine data (specifically, instrumentation of the browser) to help you streamline your site so it loads faster and keeps users engaged for longer. You can equip your marketing teams with real-time visibility into page-load times segmented by browser and by device (see the dashboard below). You can see exactly which device/browser combos are getting the best experience, and which need work. With that information, you can choose to optimize your websites and applications for Chrome users on iPads, for example.
Many organizations already use the ExtraHop platform to segment transactions by user ID, account ID, or other identifiable information using Application Inspection Triggers. For SaaS companies, this enables their IT teams to track SLA-related metrics such as HTTP errors or network latency by account. With the addition of boomerang.js, you can now also track page load time for each account.

ExtraHop can graph user-experience data against platform and device type to show a detailed view of which users have the best experience of your website, and why.
Customizable Dashboards That Explain Themselves
The dashboards included in the ExtraHop RUM bundle feature explanations for the metrics shown. Don't know exactly what a retransmission timeout (RTO) is or what you should do about it? Not to worry, the dashboard explains that for you. By the way, these text widgets are totally customizable using the Markdown language so you can leave notes for who you should contact if you see a certain type of behavior. For example, you could add: "If you see any number of dropped segments, contact Dave the network guy at dave@yourcompany.com."
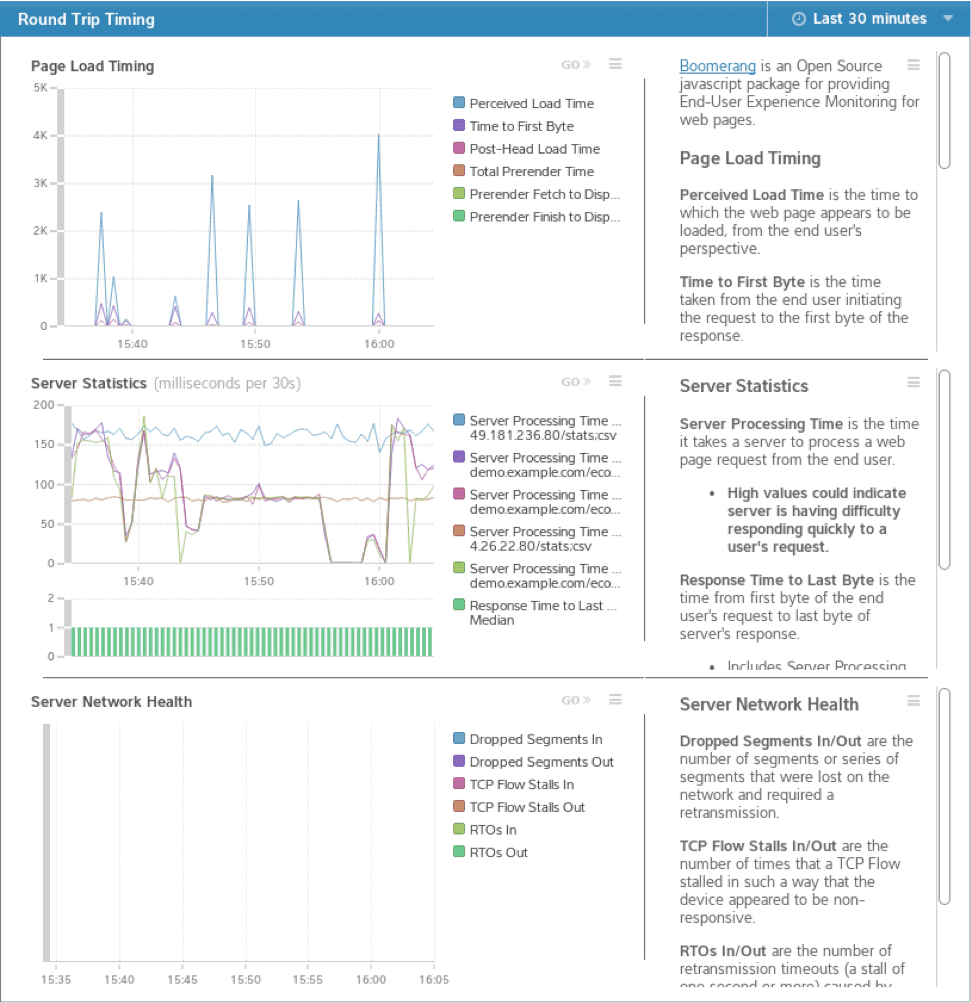
ExtraHop's dashboards include customizable text fields to provide detailed instructions about how to interpret the data shown on a graph, and what to do about it.
Built to Scale
The ExtraHop solution for RUM will work for even the largest web applications for several reasons. First, ExtraHop offers the industry's most scalable wire data analytics platform, capable of up to a sustained 100 Gbps of analysis, or the equivalent of 1.3 million HTTP transactions per second. Second, the ExtraHop platform reads the Boomerang beacon passively off the wire, which means it doesn't impact your website or network performance in any way. Finally, you can execute the Boomerang code injection on an available, full-proxy load balancer instead of on every individual web server, which cuts way down on complexity and operational overhead.
All Hands On Deck
Sharing this data with everyone in your company who needs to know is a snap. Just make an ExtraHop login for anyone who needs it, and they can access the data whenever they want to. That way, if catastrophe strikes and your users start seeing abysmal load times, your support team, network engineers, application developers, and other team members have a starting point for investigation and troubleshooting. ExtraHop's wire data analysis can serve as a "single source of IT truth" for all teams involved.
Get Started Today!
The best part of the RUM bundle is that it's FREE. Existing users can get the bundle from our bundles gallery, and even if you're not a customer yet, now is the perfect time to try the free, interactive ExtraHop demo.
Discover more

Security Product Marketing Manager
As a Sr. Product Marketing Manager at ExtraHop, Chase strives to extract the signal from the noise in the cybersecurity market, to provide security leaders and practitioners with information they can actually use to stay ahead of advanced persistent threats. Chase would never claim to be an expert at anything, but some topics he has above-average knowledge about include network detection and response, security operations, cryptography, and a grab bag of cybersecurity frameworks including NIST CSF, MITRE ATT&CK and D3FEND, and the CIS Top 20 controls.


